In this post I want to present a new kind of recommender recently introduced in Mendeley Suggest. This recommender tries to guess specific topics of interest for a user given what the user read, and provide recommendations for the three most important topics.
Introduction
Recommender systems are software components that try to predict items that a user would like. To address this task recommender systems usually rely on machine learning algorithms to learn users preferences from data. Most of the recommender algorithms are usually based on Collaborative Filtering (CF) methods that use historical data about interactions between users and items to predict future recommendations. One of the main advantages of collaborative filtering is that it is domain independent: CF algorithms can be applied to any domain, as long as data about past interactions is available. This data could be implicit, e.g. a user bought a product or read an article, or explicit, e.g. a user liked/disliked a video or rated a movie. In both cases, specific algorithms can exploit this data to provide recommendations.
CF algorithms usually provide a single list with the best items for a user. In this blogpost we are going to present the application of a common text mining technology called topic modelling to the CF domain. The advantage of this approach is that we can provide not only a single list of recommendations, but different lists based on specific themes or topics.
Mendeley Suggest
Mendeley Suggest is an article recommender for researchers. It exploits data about Mendeley users (what they add to they library, what they read, in which discipline they are, etc. etc.) to provide recommendations about articles they may want to read.
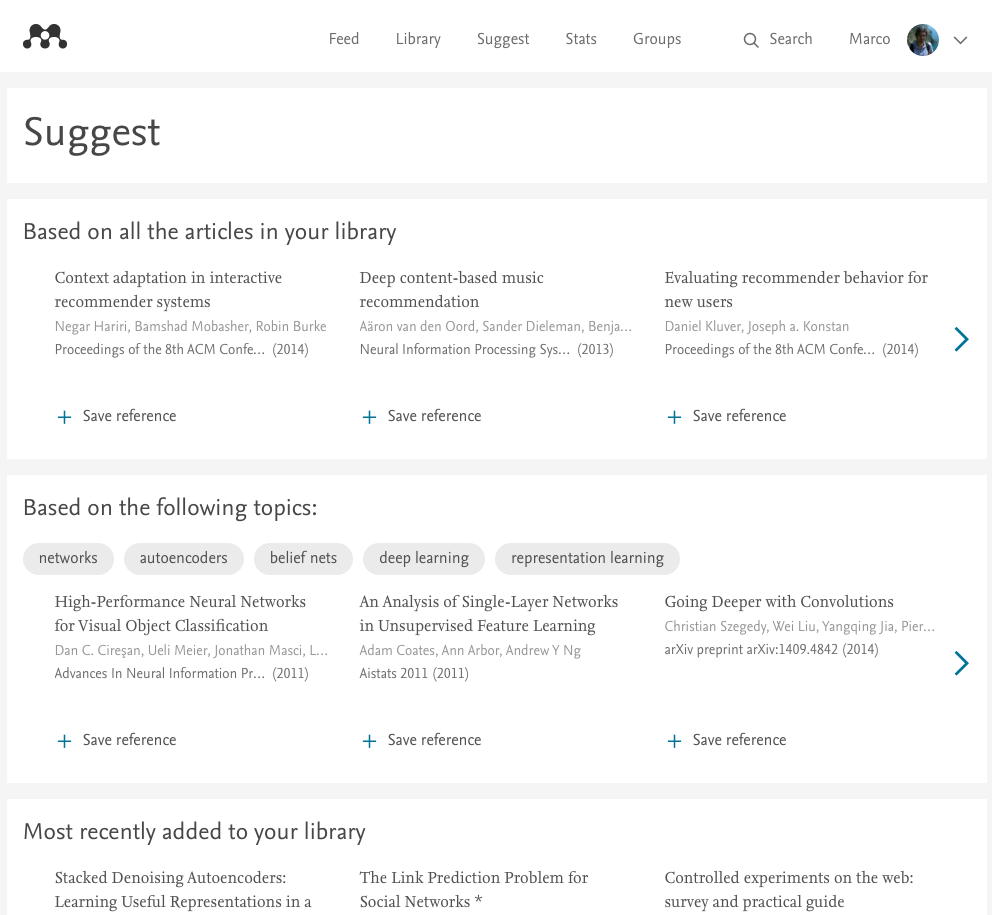
At the moment Mendeley Suggest provides different lists to address different information needs: “based on all the articles in your library” gives you recommendations based on your entire library, taking into account your recent and past interests; “popular” and “trending” in your discipline provide non-personalised recommendations, very useful for new users; “based on what you added/read last” is focused on the last action that you did, giving you contextual recommendations. For a more detailed explanation of Mendeley Suggest, check out this blogpost.
All these lists should cover different information needs that a researcher could have. In particular,”based on all the articles in your library” provides the best recommendations because it exploits the full library of a user. However, this list usually contains relevant articles about different topics, mixing them in a way that naturally represent a user’s topical interests. For this reason we thought that it would be more clear to separate these topics in different lists: in this way, not only we could provide more recommendations for a specific topic, but we are also able to explain recommendations with the topic itself.
Thematic recommendations
Provide recommendations in different lists is not a new idea. Netflix has been proposing specific lists on different genres from a long time.

In 2014 a blogpost from “The Atlantic” tried to reverse engineer the way Netflix creates micro-genres. The main finding was that Netflix is able to create thousand of micro-genres and automatically label with descriptions with a fixed structure, like “Emotional Independent Sports Movies” or “Mind-bending Cult Horror Movies from the 1980s”.
Another clear example of this kind of recommendations is provided by Amazon in their e-commerce website.
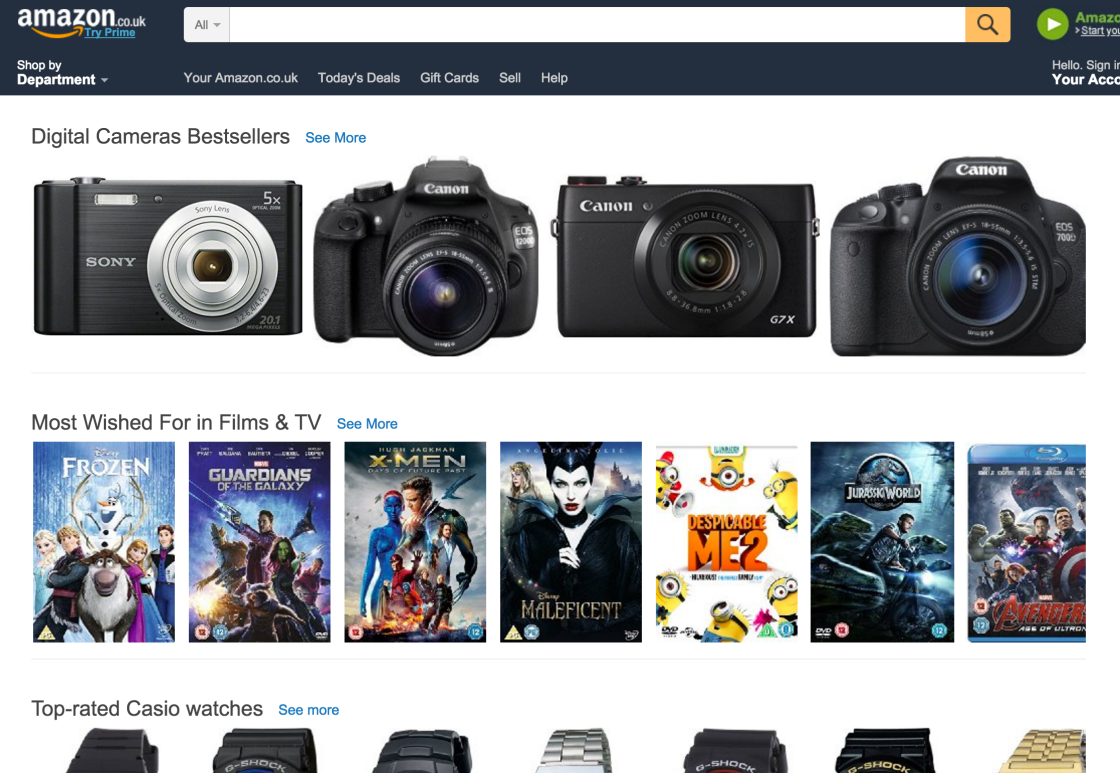
If a user browses a few items, the system provides recommendations based on the items browsed, but it usually does not mix items from different categories in the same list.
Finding themes
Finding themes in a recommender system means finding characteristics about a group of items that are of interests to a group of users. For instance, in Netflix we can find a group of users interested in romantic movies from the ’80s. In this case the characteristic is “romantic movies from the ’80s”, which belongs to a specific set of movies and which is liked by a specific set of users. In the Amazon case, a characteristic could be a product category, e.g. shoes or cameras. If we start from the characteristic is quite easy to define groups, but not every characteristic is useful. Furthermore, these characteristics could be hidden and not easy available. For this reason these themes are usually derived from past interactions between users and items: if a group of users usually interacts with a specific group of items, we can create a new theme and assign (with a certain degree of confidence) users and items to it.
The methods that usually solve this problem in the recommender system area are usually called Matrix Factorization (MF) methods. This subclass of collaborative filtering methods tries to decompose the user-item matrix in two smaller matrices. A nice explanation of MF methods (and other methods for recommender systems) can be found here.
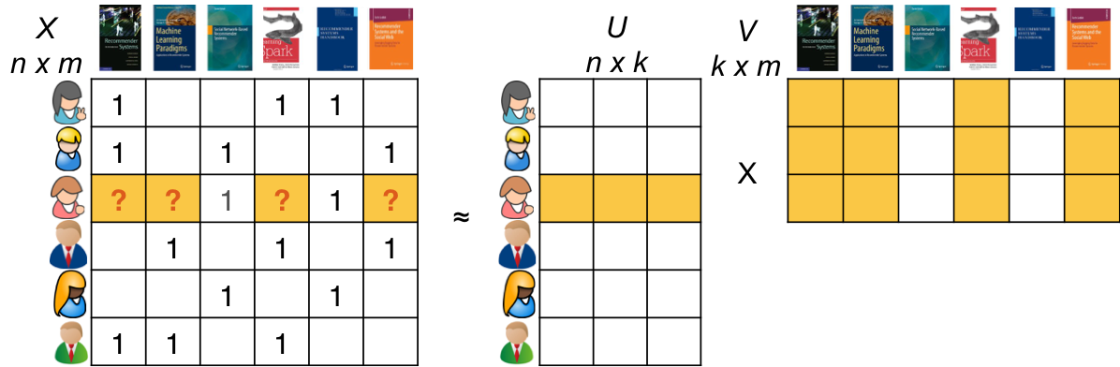
In the example provided the user-item matrix X represents users interactions with items (1 means the user read the book). X gets factorised in two smaller matrices, U and V, in a way that their matrix product is an approximation of the original matrix. Each user and each item is mapped on k dimensions (3 in the example). This means that we assume that there are k hidden themes in the data that we have. If we consider less dimensions we could get more general themes, while if we consider more dimensions we can have more fine grained themes (but if we consider too many we will probably end up with noisy dimensions). Themes can also be obtained with a combination of different dimensions. For instance, if I am interested in the dimension “romantic movies” and “action movies”, I could get recommendations for “romantic and action movies”.
There are plenty of matrix factorization algorithms available that can be used out of the box. For instance, the Spark Mllib library provides an implementation of Collaborative Filtering for Implicit Feedback Datasets. These algorithms provides a factorisation of the matrix using positive and negative values: this means that a user can be negatively associated with some dimensions, and the combination of positive and negative dimensions gives a final estimation of the relevance of an item for a particular user. In this case analysing dimensions independently could not make sense, because they are supposed to be considered together.
A different technique that applies a similar strategy, but to extract topics from natural language text, is topic modelling. Topic modelling was first introduced by Blei in 2003 with the Latent Dirichlet Allocation (LDA) model. The approach is very similar to matrix factorization on the user-item matrix. In this case we consider the term frequency (TF) matrix, where we have documents on the rows, words on the columns and number of occurrences of a word a in a document as the content of the matrix. Topic modelling extract topics from the documents, which means that documents have a probability distribution on topics and topics have a probability distribution on words.
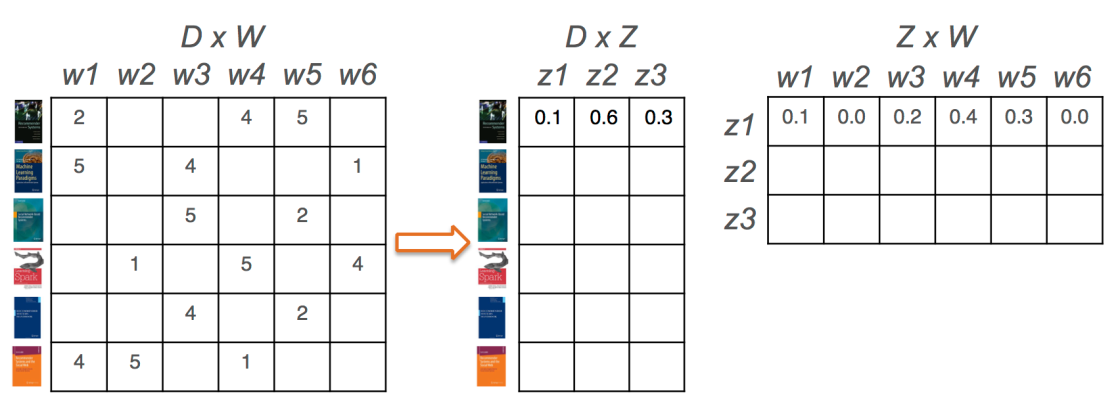
The topics extracted with this technique are easy to interpretate, because they can be represented as list of words with a coherent semantic meaning.

If we want to apply topic modelling on the user-item matrix for recommendations, we can consider users as documents and items as words.
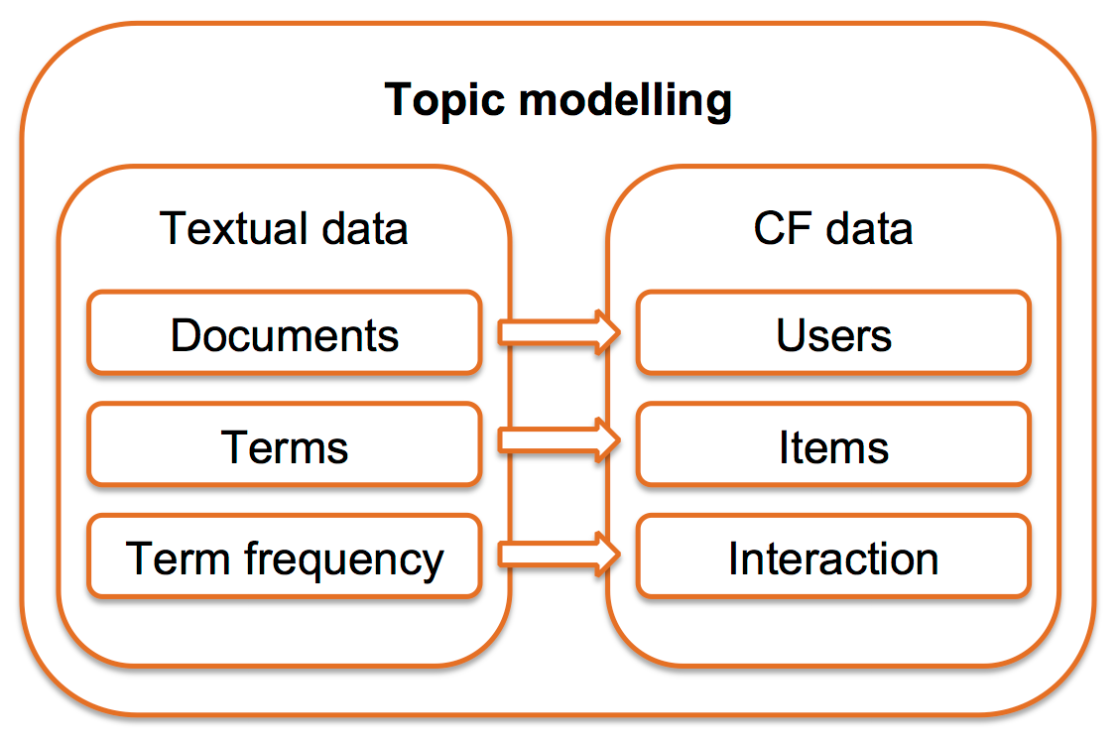
In this way the topics extracted are list of items with something in common. What they have in common depends on the domain: for e-commerce products it can be the category, for movies it can be the genre, for research articles it can be the research area.
To test this approach in the Mendeley domain, we applied LDA on user libraries for computer science users using the RankSys framework, which wraps Mallet for topic modelling in a way that reduces the memory footprint. Mallet is one of the most efficient non distributed implementation of LDA. We extracted 200 topics from the libraries of computer science users and we manually inspected the top 10 articles for each topic.
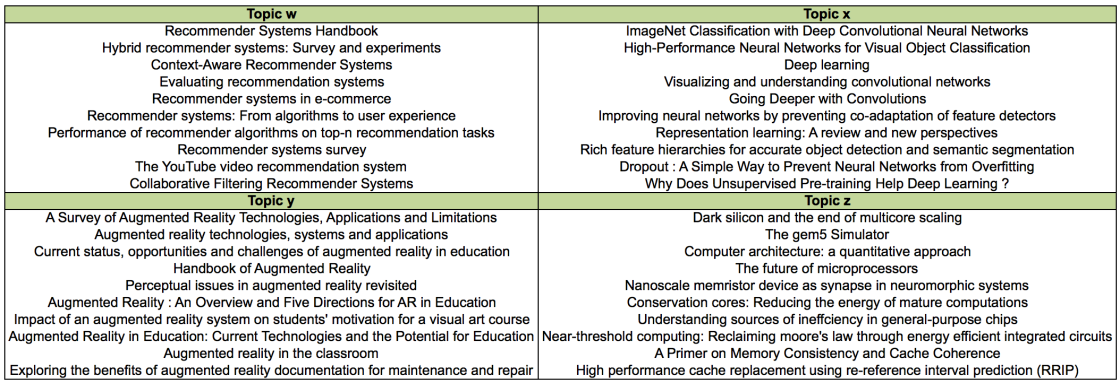
It was quite clear that the topics extracted represent quite well research areas. The number of topics determines the granularity of them, as we saw that with a lower number of topics we had more general topics, while increasing the number we were able to find more specific themes. Moreover, these topics can be naturally seen as recommendation lists on specific research interests. All these characteristics make topic modelling a very good candidate for a topic-based recommender.
Creating labels
One of the main disadvantages of topic modelling is the fact that topics are not easily labelled. Usually the list of the top words is used to interpretate and understand a topic, but it’s far from a clean label. This problem is not only limited to topic modelling, but to any clustering technique. In our case, topics can be represented with list of documents, as shown in the previous figure. Looking at the article titles, it’s quite clear that some terms or combination of terms appear frequently in a specific topic, and they can be used to label the topic itself. To automatically create these labels we extracted noun phrases from the top 100 titles for every topic, and we combined them with author defined keywords that are part of the metadata of an article. The most frequent phrases and keywords are then selected to represent the topic.
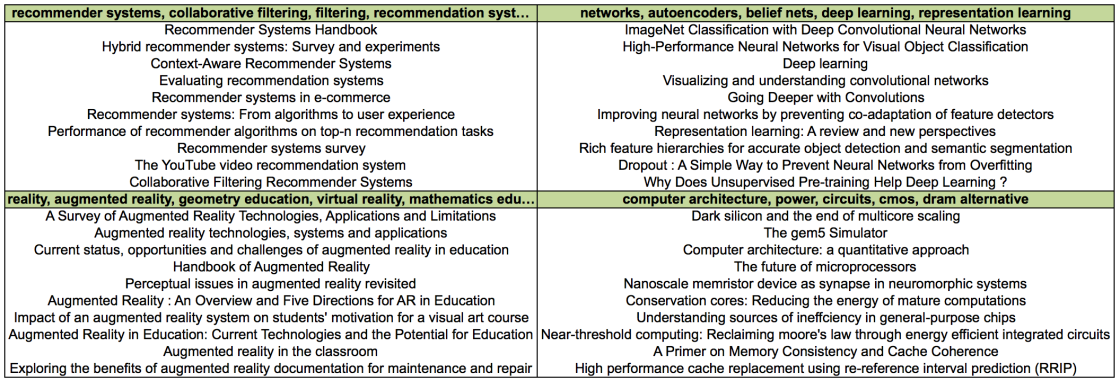
Even with this simple technique the labels created clearly represent the topics. Further effort could be spent to improve the labels, removing or keeping plurals, avoiding single and composite terms, and so on.
Finding the latest topics for a user
If we want to provide recommendations based on topics for a specific user, we need to understand in which topics a user is interested. A research article can be about many topics, but for simplicity we consider that an article is only associated with the top one topic for that article. After that, we scan a user library from the latest added document and we select three topics from the latest added documents. This simple strategy ensures that we capture the most recent interests of a user and we provide recommendations focused on what he is currently working on.

Conclusions
In this blogpost I presented the recently introduce topic-based recommender. Topic-based recommendations can be very useful for a user because they provide items in specific sublists that are easier to process since they are on specific topics. Furthermore, describing these lists with meaningful labels makes them easier to identify and process. In Mendeley we decided to provide these recommendations for users in computer science as a live experiment. By considering only the latest added articles we are able to find only the recent research interests of a user. Up to know, results are encouraging and show that users like topic-based recommendations.
Topic-based recommendations are far from perfect. The main future lines of work are: tuning the topic modelling extraction by selecting the right number of topics; scaling the process to all disciplines; improving the label creation process; mapping the user to the right topics.


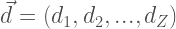
 can be represented by the following vector in the topic space:

 is the set of user
 , where each component
  indicates how strong is the connection between the topic
  and the neuron
  .
.
 , we need to transform the user-topic vector
  into the user-map vector
  where:


